Posts

Mapping out COVID-19 Cases in Nepal

Image
Case #1, January 24, 2020,  Recovered on February 7.  The first case of COVID-19 was reported in January 24, 2020 in a male of 32 years age. It was in a Nepali PhD student who came from Wuhan China. His blood samples were taken to Singapore for Polymerage (PCR) test, and he was confirmed positive. he was admitted to Shukra Raj Tropical Hospital on ... and Discharged on...The patient had shown mild symptoms, and was completely cured by the end of January. A 31-year-old student of  Wuhan University  who had returned home on 5 January, [49]  was admitted with mild symptoms on 13 January and discharged on 17 January with instructions to self-quarantine at home after preliminary tests showed he may not be infected. [50]  Although Nepal had the laboratories and the skilled manpower to test for the disease, Nepal did not have the  reagents  required. The reagents cost around  Rs  17,000 per test and need to be bought in bulk, sufficient for about 200 tests. As there were no other suspecte
Tropical Rainfall Measuring Mission (TRMM/NASA) rainfall forecast for 27 June for South Asia

Rainfall Update: Rainfall declining in coming days (June 24-27, 2013) Please see the visualization of rainfall intensities in the form of maps in the following pages.  The colored patches are the areas where heavy rainfall occurred in the past and is expected in the coming week. The red colored areas are where minimum rains and the purple ones are the areas where maximum rains occurred. You will see two kinds of maps (a) forecast for June 27, and (b) trend of rainfall. 1. Forecasts Forecast for June 27, 2013 (72 hrs from June 24, 2013, 0600 UTC) This is rainfall prediction for June 27, UTC 1200. Not so heavy rains expected in the region. The red colored areas represent average 100mm and yellow colored dots represent 200mm rainfall for  May 27, 2013 at 1200 UTC. 2. Recent rainfall trend 24 hours accumulated rainfall on June 24 by UTC 0600 Minimum 35 mm, central region of Nepal,  India, Bangladesh, Thailand and Cambodia and has almost no variability of rain. 3

Draft Remote Sensing Satellite Views of the Sun Koshi Landslide

Image
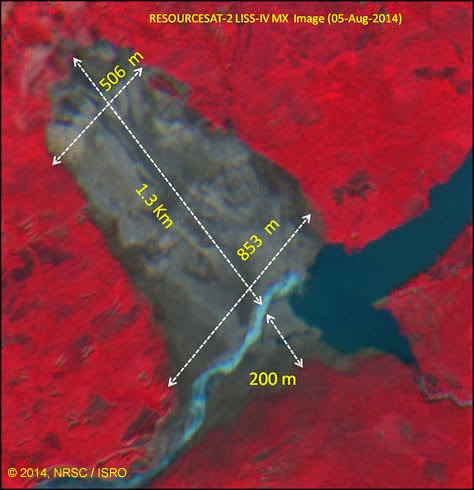
Remote Sensing Satellite Data Visual Analysis of the Sun Koshi Landslide  Indra Sharan KC National Remote Sensing Center of Indian Space Research Organization, Government of India published Satellite Images of recent Landslide on Sun Koshi River in Nepal. Huge peace of mountain slope The landslide had taken place on August 2, 2014. Nepal Army had been using light explosives, heavy equipment and muscle power to clear open channel to release water from the 2.36 km long, 200 m wide lake with a surface area of 44 Ha formed from the 5.5 million cubic meter debris deposit on Sunkoshi's bend in Jure. The landslide killed 156 people and destroyed 33 houses; a 2.5 KW hydropower plant in Sunkoshi Bazar; intake structure of 10KW Sunkoshi hydro in Lamosangu; transmission lines and towers and about 1.5 KM of road in Ramche and Jure. There was 67 MW of power less in the grid, due to this landslide which added extra 4 hours of load shedding in the regular load shedding of daily 10 hours. Si

Nepal's Total Installed Hydro-power

Image
Nepal's Total Installed Hydro-power: 917.484 MW Indra Sharan KC, GISP As per Department of Electricity's Data, the total installed hydro-power of Nepal is 917.484 MW. As of December 8, 2017, there are total 76 hydro-power plant sites producing total 917.484 MW.  There are 13 sites that produce below 1 MW, total of all 13 sites is 9.975 MW. Remaining 63 sites produce more than 1 MW at each location, thus total of all 63 sites is 907.509 MW. The following map shows the distribution of the hydro-power plant sites. At the moment, most of the hydro-power plants are concentrated in Provinces 4 and 3. Province 1 ranks the third. Province 5, 6 and 7 have few of the plants. Province 2 does not have single hydro-power plant. It gets from other provinces. For detailed data source please refer to these tables from Department of Electricity, Government of Nepal: Table 1:<1 a="" hydro-power="" mw="" nbsp="" operating="" sit

Golden Rice Fields

Image
Golden Rice Fields Indra Sharan KC Rice fields are level terraces with bunds, for it requires water to be collected for at least 6 inch for about three months from plantation time in July. It is harvested in November. Rice fields are kept dry for about one two two months for better yield and for better harvest practices.  Before one months of harvest, rice start changing from green to brown to golden color, contrasting with other greenery in the surrounding Pawai Gamde VDC, has total area of 13 Sq km.  The land that grows rice in Pawai Gamde  is divided into two geomorphological units: Suraudi khola rice fields (at elevation of 700 to 900 meter) and Pawai khola rice fields (1000 to 1200 meter).  The fields in this picture are from Pawai Khola area.         Picture taken on fifth day of Dipawali (October 19, 2008). Dipawali is related to, among many other things, agricultural prosperity.

Sun Koshi Landslide: Indian Remote Sensing Satellite Data - Visual Analysis

Image
Sun Koshi Landslide: Indian Remote Sensing Satellite Data - Visual Analysis  Indra Sharan KC Sept 29, 2014. Kathmandu This blog is based on data and information made available at National Remote Sensing Center Website : http://nrsc.gov.in/ Accessed on Sept 17, and 29, 2014). Therefore NRSC is gratefully acknowledged. All the images are provided with their original source links .  These images are copy righted to NRSC/ISRO. National Remote Sensing Center (NRSC) of Indian Space Research Organization (ISRO), Government of India  published Satellite Images of recent Landslide on Sun Koshi River in Nepal. The landslide had taken place on August 2, 2014. The landslide killed 156 people and destroyed 33 houses; a 2.5 KW hydropower plant in Sunkoshi Bazar; intake structure of 10 KW Sunkoshi hydro in Lamosangu; transmission lines and towers and about 1.5 KM of road in Ramche and Jure. There was 67 MW of power less in the grid, due to this landslide which added extra 4 hours of load s

Constituent Assembly Election Results Map as of November 22, 2013, 4PM

Image
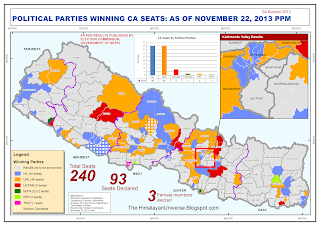
As of November 22, 2013, by 4:pm The counting of the votes, from the Constituent Assembly Election held on November 19, 2013, have shows that out of 240 seats, the winning parties and candidates for 93 seats have been declared. There are only 3 women candidates elected so far. The below map shows the spatial patterns of political parties winning the CA seats. The NC and UML have 40 seats each. UCPN (Maoist) has won 8 seats. Download the map for viewing the results on your own.